School Projects
These were all Final Projects I had done in School. This list only contains the ones related to computer science. Nearly all of my projects can be found on my github account. The list is in chronological order.
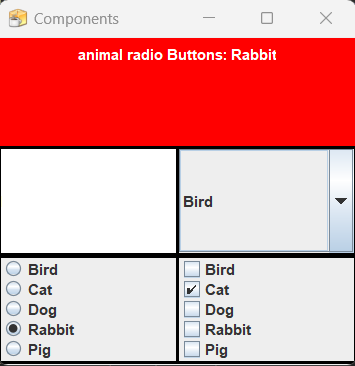
CSCI 1302 Project: For my Java II class at The College of Coastal Georgia, I had to make a GUI. The Gui contained 6 elements. A drop-down list, radio boxes, check boxes, a text field, and a display area. Whatever you wrote in the text box would display in the display area. Similarly, whatever you picked from the drop-down list, radio buttons, or check boxes would also display. For my project, every field had the exact same information, a list of animals. So, I had to generate different ways of making sure the information generated accurately.
CSCI B104 Project: My first semester at USCB contained my first project. This project was a two-person team, where I took a more subordinate role. We were tasked with getting data from the Youth Risk Behavior Surveillance System , or YRBSS, and doing research on it. The YRBSS is a survey that checks the health of young people at various schools. It tests for things like race, sex, height, sexuality, drinking habits, smoking habits, sexual habits, and mental health. We had to decide on two of the topics and form our research on it. We decided to look into sexual behavior, and risk of STDS. We had to take the data and reformat in a way that could be read by a heatmap and pie charts. We used Python for all of this, alongside Microsoft Excel and Microsoft Access. We then placed our findings in a poster. Me personally, I had done a lot of the coding. I believe I figured out the code for the heatmap, and some of the code for the pie charts. Then we both did the presentation. You can find my Poster here.

CSCI B320 Project: My next project was for Database System Management. I was in a two-person team where I took a leadership role this time. Mw and my partner had to create a database and populate it. We used Microsoft SQL Server (MSS) to create the database. Microsoft Azure to hold the data for the database. And of course, the Transact-SQL language. The database we had to create was a registrar system. The USCB registrar gave us data from all the classes taught for the past 10 years, and compiled it in an excel file. This data included class titles, descriptions, CRN numbers, subjects, professors, meeting days, meeting times, sections, course numbers, the semester it was taught, and the year it was taught. Then we generated students, and assigned them classes.
Our first step was to design an Entity Relation Diagram (ERD) that held the relationships between all the tables. Then we had to import the data from the given excel files into MSS, and normalize the data to fit into the assigned tables. Then we exported the newly formatted data and ran it through the SQL-izer. We took that data and put it into the database. We had to write some code to match the primary keys to the foreign keys in tables where they are present. Finally, after we got all of the data into the database, we had to make 9 queries. The queries were designed around the idea of someone looking up information on the students and classes, to assess how they should move forward with the school. My contributions to the project include, designing the ERD, populating the database, writing eight of the nine queries, and designing half of the student data. Me and my partner then had to do a presentation showing all we did.
ENGL B262 Project: This project was for Introduction to Technical Writing. In this class we learned about technical writing, which is to take a difficult topic and write it in a way that is easily understood by most people. For my Final Project I had to find a document that was either too technical, too vague, or too long, and write it in a more accessible way. I found this article about raising neonatal kittens. To me, the article was too technical. A lot of words were scientific, and a lot of phrases were repetitive. I intended to reduce those problems by using easier to understand words and avoiding repetition. Another problem I had was the organization. I think an effective cat document should be organized in a way that a cat owner could actually use it. If it's for raising cats it should be in an order that would follow a cat owners’ journey. Putting weaning immediately after feeding, and then adding defection and urination after it doesn't make any sense. Kittens are house trained before they are even weaned. Another tool I added to make sure people revisited the document was to use the bulleted list as a summary. That way, if someone is new to raising kittens they can read the whole paragraph to understand the big picture, and if they just need a quick summary at a later date, they can look at the bulleted list. My re-write is here.
CSCI B102 Project: This project was for Introduction to HTML and CSS. The project was... This website! In this class I was responsible for making my own website. It has to contain images, links, a navigation menu, margins, borders, floating, and responsive web design. It should also be accessible to most people. I had to add at least two enhancements that the professor specified. I chose Embedded Fonts, an image rollover. and an image with a caption. I had to use at least one jQuery and JavaScript enhancement. I chose an accordian, which you can view on the education page.
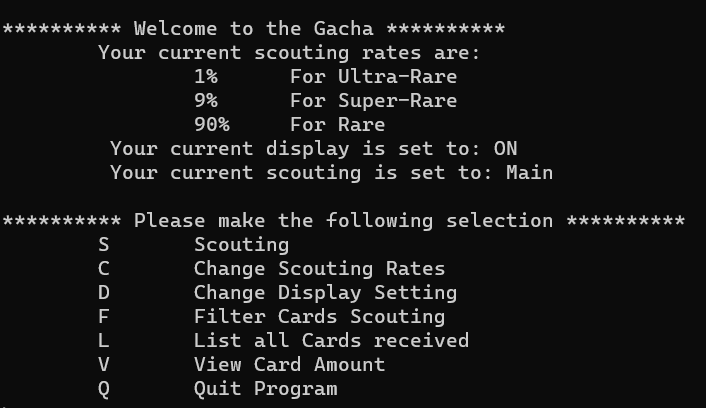
CSCI B450 Project: This project was for Modeling and Simulation. I had to make a simulation in excel VBA. The simulation I chose was modeling a doctor's clinic. The clinic takes same-day appointments, but they can't treat every person who calls in. An obvious solution would be to add another Doctor, but I wanted to make it more interesting. Because there are generally three types of pre-scheduled appointments, Mental Health, Sick visits, and Wellness Checks.I compared the results of adding a Doctor that only handles same-day appointments, and a Doctor that only handles mental-health appointments. To make the simulation, I needed to make my own functions for the distributions. I used Poisson and triangular distributions.
CSCI B466: This project was about visualizing Data. We used the data set Iris to demonstrate PCA. Me and a partner had to factor the data using techniques from PCA. Then we had to explain the graphs and problems to demonstrate that we knew the material. Our project was created in R using RStudio, and our presentation was done in RMarkdown.
CSCI B365: For this class I had to use OpenGL and GLUT in C++ to make an animated image. I made a cat-themed clock, where the eyes would move left and right, while the clock hands rotated around the clock-face. The animation had to contain a menu as well, so a user can change the color. After this, we had to create a 3D image that rotated around a central point. I had a crane machine rotate two objects counter-clockwise. Then a smaller person would have fire rotating around her, and she went around the crane clockwise..
CSCI B422: This project was to participate in the Kaggle Machine Learning Titanic Competition..It was a two-person partnership, where we kind of did our own thing. The goal of the competition is to take the training set Kaggle provides and see if you can use machine learning to create a model to accurately guess who survived and who died aboard the Titanic. The model would be tested on the test dataset, where the survivors where who survived is known only by Kaggle. Because it was machine learning, me and my teammate tested various different models to see which one would return the most accurate answer. My teammate did most of the pre-processing, which included Scaling, One-Hot Encoding, and Simple Imputation. I created the best algorithm using a Neural Network.
CSCI B470: This project we had to create a web-based application using JAVA. I was in a team of three, where I was elected the leader. My resposibilites included not only leading, but also writing the java servlets, and methods to attach the web-app to the database. The Web-app we created was a virtual Dice Roller. On the main page you could pick between one of 6 dice, and specify the number of dice you wish to roll, and get your roll result. Then we had a custom roll page where you could name your dice, and add a modifier to your result. You could create up to 6 custom dice. If you wished, you could register an account and your result history and custom dice would be saved. You can view the web-app here.